Dyno Proven
Real Dyno Results - Verified Performance Gains
Real results.
Every dyno chart displayed here represents before-and-after testing on real vehicles, measured on professional dynamometer equipment. No simulations. No estimates. No marketing guesses. Just documented horsepower and torque gains you can verify.
Performance claims are easy to make. Dyno data proves them. These results show how performance chips, intakes, and exhaust upgrades affect real engines under controlled conditions.
If you want evidence instead of promises, you're in the right place.
Testing Methodology
All dyno results are based on Stage 1 performance chip + Cold Air Intake + Cat-Back Exhaust System tested on a professional DynoJet 224X dynamometer under controlled conditions.
Stage 1 Complete System Results
Performance gains from combined Stage 1 chip, cold air intake, and cat-back exhaust system
| Year | Vehicle | Base HP | HP After | HP Gain |
|---|---|---|---|---|
| 2001 | BMW M3 | 333 HP | 379 HP | +46 HP |
| 1994 | VW Jetta VR6 | 180 HP | 210 HP | +30 HP |
| 2002 | Cadillac Escalade | 255 HP | 299 HP | +44 HP |
| 1996 | Acura Integra | 142 HP | 178 HP | +36 HP |
| 2002 | Ford Mustang V6 | 270 HP | 302 HP | +32 HP |
| 1999 | Chevy Silverado | 255 HP | 310 HP | +55 HP |
| 2002 | Honda Civic | 137 HP | 165 HP | +28 HP |
| 2006 | Nissan Titan | 317 HP | 398 HP | +81 HP |
| 2007 | Mazda Speed 3 | 263 HP | 310 HP | +47 HP |
| 2001 | Audi A4 | 182 HP | 222 HP | +40 HP |
Visual Dyno Evidence & Test Cases
Test Case 1 Stage 1/2 Performance Comparison
Watch real-time dyno testing showing before and after performance gains with Stage 1 and Stage 2 upgrades.
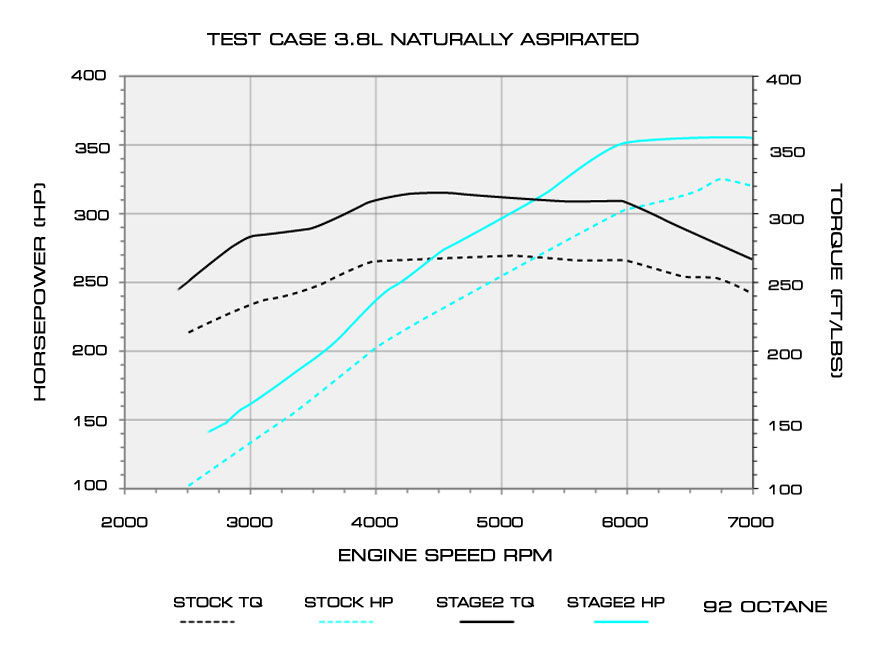
Test Case 2 Stage 2 - 6 Cylinder Engine
Dyno chart showing impressive gains on a 6-cylinder platform with Stage 2 tuning.
Test Case 3 2013 Jeep Wrangler 3.6L - Intake + Stage 3
Performance results from a 2013 Wrangler with 3.6L engine equipped with cold air intake and Stage 3 performance chip.

Test Case 4 Subaru WRX STI - Intake/Exhaust + Stage 3
High-performance results from a WRX STI with complete intake/exhaust system and Stage 3 tuning.

Want These Results for Your Vehicle?
Browse our performance parts by vehicle make to find the exact upgrades that delivered these proven gains. All products are tested, verified, and designed for plug-and-play installation.
Stage 3 Chip-Only Performance Estimates
Estimated horsepower gains from Stage 3 performance chip alone (calculated based on proportional contribution from complete system testing)
| Year | Vehicle | Base HP | Estimated HP After | Estimated HP Gain |
|---|---|---|---|---|
| 2005 | BMW M3 | 333 HP | 356 HP | +23 HP |
| 1994 | VW Jetta VR6 | 180 HP | 195 HP | +15 HP |
| 2002 | Cadillac Escalade | 255 HP | 273 HP | +18 HP |
| 1996 | Acura Integra | 142 HP | 160 HP | +18 HP |
| 2001 | Ford Mustang V6 | 270 HP | 286 HP | +16 HP |
| 2000 | Chevy Silverado | 255 HP | 282 HP | +27 HP |
| 2002 | Honda Civic | 137 HP | 151 HP | +14 HP |
| 2006 | Nissan Titan | 317 HP | 357 HP | +40 HP |
| 2007 | Mazda Speed 3 | 263 HP | 297 HP | +34 HP |
| 2001 | Audi A4 | 182 HP | 202 HP | +20 HP |
Stage 4 Dyno on Honda Ridgeline
